TL;DR:
- Fulfilment KPIs are essential metrics that quantify the efficiency of order processing from placement to delivery. They help identify operational strengths and weaknesses by revealing upstream constraints affecting key outcomes like on-time delivery and order accuracy. Standardizing definitions, reviewing layered metrics regularly, and linking KPIs to profitability are crucial for business growth and supply chain optimization.
Fulfilment KPIs are the measurable indicators that quantify how effectively orders move from placement to delivery, giving e-commerce managers and logistics professionals a direct view of supply chain health. Understanding fulfilment KPIs is not optional for growing brands. It is the foundation of every decision that affects operational efficiency, customer satisfaction, and profitability. The core metrics include On-time Delivery Rate, Order Accuracy, Perfect Order Rate, Cost Per Order, and Inventory Accuracy. Industry benchmarks from sources such as Fairview and G10 Fulfillment set the standard, and knowing where your operation stands against those benchmarks is the starting point for meaningful improvement.
What are the core fulfilment KPIs and how are they measured?
Fulfilment performance metrics fall into four categories: speed, accuracy, cost, and customer experience. Each category captures a different dimension of your operation, and no single metric tells the full story.

The table below summarises the most critical KPIs for order fulfilment, their formulas, and the benchmarks your operation should be targeting:
| KPI |
Formula |
Industry benchmark |
| On-time Delivery Rate |
(Orders delivered on time / Total orders) x 100 |
95% or above |
| Order Accuracy Rate |
(Accurate orders / Total orders shipped) x 100 |
99.5% or above |
| Perfect Order Rate |
(Orders with no errors / Total orders) x 100 |
90% to 95%+ |
| Inventory Accuracy |
(Counted inventory / System inventory) x 100 |
99% or above |
| Order Fulfilment Rate |
(Orders fulfilled completely and on time / Total orders) x 100 |
97% to 99% |
| Cost Per Order |
Total fulfilment cost / Total orders shipped |
Below 20% of average order value |
One distinction worth understanding clearly is the difference between Order Fill Rate and Order Fulfilment Rate. Order fill rate measures inventory readiness, while Order Fulfilment Rate measures end-to-end execution effectiveness. A low Order Fill Rate alongside a high Line Fill Rate often points to specific SKU stockouts that are causing entire multi-item orders to fail. These two metrics reveal different supply chain realities, and conflating them leads to misdiagnosis.
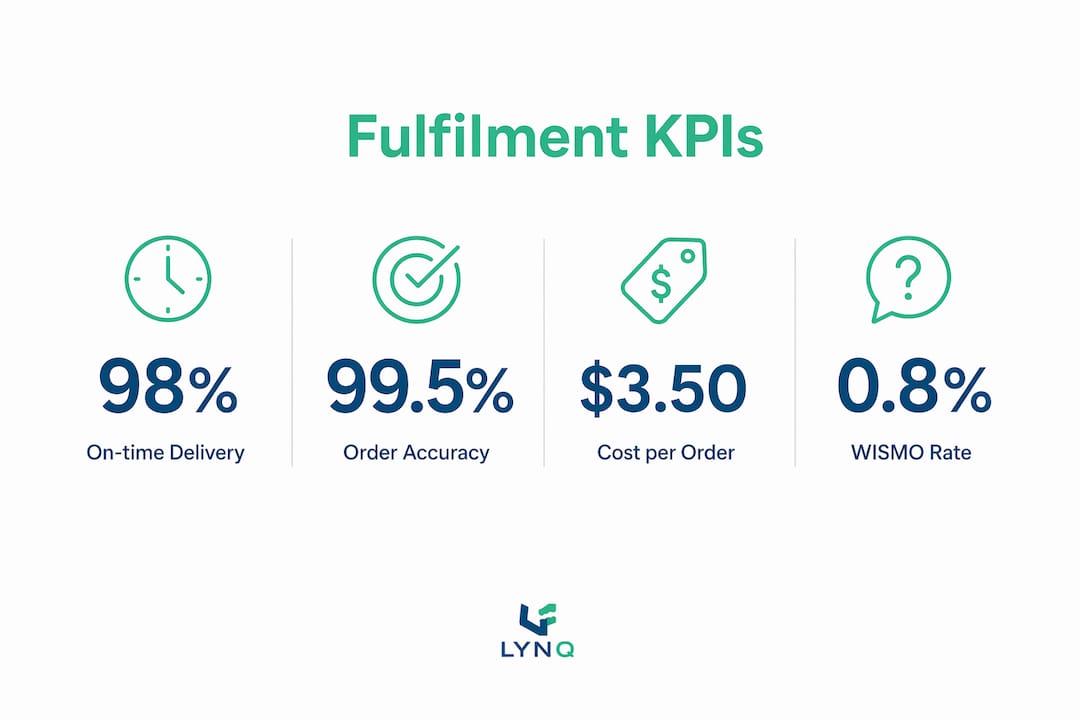
The WISMO (Where Is My Order) rate is another fulfilment efficiency indicator that is frequently underestimated. A high WISMO rate signals gaps in post-dispatch communication and tracking visibility, both of which erode customer trust faster than a delayed parcel.
Pro Tip: Review your On-time Delivery Rate and Order Accuracy Rate weekly, your Cost Per Order monthly, and your Inventory Accuracy per cycle count. Quarterly reviews are too infrequent and risk delayed detection of performance issues that compound quickly.
How do fulfilment KPIs reveal operational strengths and weaknesses?
KPIs for order fulfilment do more than report outcomes. They expose the upstream constraints that cause those outcomes, and that is where their real value lies. KPIs reveal upstream constraints invisible in single metrics, helping logistics teams target bottlenecks before they reach the customer.
Consider a scenario where your On-time Delivery Rate drops from 97% to 93% over three weeks. A surface reading suggests a shipping problem. But a layered KPI review might reveal that cycle times in the pick-and-pack stage have crept up, creating a backlog that pushes orders past the carrier cut-off. The shipping carrier is not the problem. The warehouse process is. Without the KPI data to trace the issue upstream, you would likely spend time and money solving the wrong problem.
The following operational signals are worth monitoring closely:
- Receiving backlogs: A rising time-to-receive metric indicates inbound processing is falling behind, which directly affects inventory availability and order fill rates.
- Cycle time creep: Gradual increases in pick-to-ship time often indicate staffing gaps, poor slotting, or SKU proliferation creating congestion in the warehouse.
- Route inefficiencies: Delivery KPIs that vary significantly by region or carrier point to route planning or carrier selection issues rather than warehouse failures.
- Inventory mismatches: Discrepancies between system inventory and physical stock cause phantom availability, leading to orders that cannot be fulfilled despite appearing viable.
Standardising KPI definitions across your operation is non-negotiable for credible data. If one team measures On-time Delivery from order placement and another measures it from order sync, you are comparing different things. That inconsistency produces misleading data and ineffective decisions. A warehouse operations checklist can help you align definitions and processes before you start measuring.
Review cadence matters as much as the metrics themselves. Speed and accuracy KPIs need weekly attention. Cost metrics are better reviewed monthly, where trends become visible without the noise of daily fluctuation. Inventory accuracy should be reviewed per cycle count to catch discrepancies before they compound.
What are common challenges and misconceptions in interpreting fulfilment KPIs?
The most persistent misconception in fulfilment operations performance is that a single SLA percentage reflects the customer experience. It does not. A 95% On-time Delivery Rate sounds strong until you recognise that 5% of your customers received a late order. At scale, that is thousands of negative experiences per month, each one carrying chargeback risk and lifetime value erosion.
“Misunderstanding or inconsistent KPI definitions leads to misleading data and ineffective operational decisions.” — G10 Fulfillment
Precise timing definitions are the foundation of credible KPI data. When does the clock start on an order? At placement, at payment confirmation, or at order sync to the warehouse management system? When does it stop? At warehouse dispatch, at carrier acceptance scan, or at delivery confirmation? Teams must standardise precise definitions of KPI timeframes and exception rules to produce metrics that accurately reflect operational reality. Without this, your data is measuring process assumptions rather than actual performance.
Shipment status reporting creates another common blind spot. Warehouse completion and carrier acceptance are two different events, and treating them as one masks where delays actually occur. Scan-based execution ensures KPI data credibility. Manual processes, by contrast, undermine accuracy and make it impossible to pinpoint whether a delay happened inside the warehouse or after handoff to the carrier.
Brands managing multiple third-party logistics providers face an additional layer of complexity. Aggregating KPI data across providers with different definitions, systems, and reporting formats produces figures that are difficult to compare and easy to misread. The solution is to define your KPI framework centrally and require all providers to report against it consistently. Treating fulfilment as a revenue-critical function, rather than a back-office cost centre, is the mindset shift that makes this investment worthwhile. Every percentage point improvement in your Perfect Order Rate maps directly to contribution margin and customer lifetime value.
How can businesses improve fulfilment KPIs to enhance supply chain efficiency?
Improving fulfilment KPIs requires targeted interventions at the process level, not broad operational overhauls. The following five steps address the most common performance gaps in e-commerce fulfilment:
- Build real-time inventory visibility. Accurate, live stock data prevents phantom availability and reduces order cancellations. Warehouse management systems integrated with your e-commerce platform are the baseline requirement here.
- Strengthen demand forecasting. Use historical sales data, seasonality signals, and promotional calendars to anticipate demand. Poor forecasting is the primary driver of stockouts and overstock situations that damage both Order Fill Rate and Cost Per Order.
- Implement smart replenishment. Set dynamic reorder points based on lead times and demand variability rather than fixed thresholds. This reduces both stockouts and excess inventory carrying costs.
- Optimise route planning. Carrier selection and route logic directly affect On-time Delivery Rate. Regularly review carrier performance by region and service level, and adjust routing rules accordingly.
- Integrate sales and distribution management systems. Improvement strategies include real-time inventory visibility and integrated systems that connect sales, warehouse, and carrier data into a single operational view.
The table below compares these strategies against their expected KPI impact:
| Strategy |
Primary KPI impacted |
Operational benefit |
| Real-time inventory visibility |
Inventory Accuracy, Order Fill Rate |
Eliminates phantom stock and reduces cancellations |
| Demand forecasting |
Order Fulfilment Rate, Cost Per Order |
Reduces stockouts and overstock costs |
| Smart replenishment |
Inventory Accuracy, Perfect Order Rate |
Maintains optimal stock levels dynamically |
| Route optimisation |
On-time Delivery Rate |
Improves carrier performance by region |
| Systems integration |
All KPIs |
Creates a single source of truth for operational data |
Aligning your KPI targets with direct-to-consumer profitability goals is the step most operations skip. Fulfilment failures affect both operations and revenue. Chargebacks, returns, and customer service costs all increase when fulfilment KPIs fall below benchmark. Measuring fulfilment success through a profitability lens, not just an operational one, keeps your improvement efforts focused on outcomes that matter to the business.
Pro Tip: On-time fulfilment rates above 99.9% are achievable when you segment KPIs by channel and service level rather than reporting a single blended figure. A same-day shipping KPI and a standard delivery KPI should never be averaged together.
Key takeaways
Measuring fulfilment success requires standardised KPI definitions, layered metrics across speed, accuracy, cost, and customer experience, and a review cadence matched to each metric’s operational impact.
| Point |
Details |
| Standardise KPI definitions |
Define start and stop times, exception rules, and reporting formats centrally before measuring anything. |
| Use layered metrics |
No single KPI reflects the full customer experience; combine speed, accuracy, cost, and WISMO data. |
| Review at the right frequency |
Check speed and accuracy weekly, cost monthly, and inventory accuracy per cycle count. |
| Distinguish similar metrics |
Order Fill Rate and Order Fulfilment Rate reveal different supply chain realities and must not be conflated. |
| Link KPIs to profitability |
Every percentage point improvement in Perfect Order Rate directly affects contribution margin and customer lifetime value. |
Why I think most businesses are measuring fulfilment the wrong way
After working closely with e-commerce logistics teams across a range of sectors, the pattern I see most often is not a lack of data. It is an excess of poorly defined data. Teams report a single On-time Delivery percentage and treat it as a health check. It is not. It is a headline that obscures more than it reveals.
The operations that genuinely improve their fulfilment performance are the ones that get granular. They separate warehouse cycle time from carrier transit time. They segment KPIs by sales channel, service level, and SKU category. They review their data weekly, not quarterly. And critically, they treat their KPI definitions as a living document, revisiting them whenever a process changes.
The other shift I would encourage is viewing fulfilment KPIs as growth enablers rather than operational scorecards. When your delivery accuracy improves, customer loyalty follows. When your Cost Per Order falls, margin expands. These are not warehouse metrics. They are business metrics. The brands that understand this connection are the ones that scale with confidence rather than firefighting every peak season.
— Lukasz
How Parcelplanet supports your fulfilment KPI goals
Parcelplanet’s order fulfilment services are built for e-commerce and omnichannel brands that need transparent, measurable performance across every stage of the fulfilment process.

Through real-time tracking, platform integrations, and clear reporting, Parcelplanet gives you the visibility to monitor your fulfilment performance metrics without chasing data across disconnected systems. Whether you are scaling order volumes, expanding into new regions, or managing complex SKU catalogues, the team at Parcelplanet provides the operational infrastructure to keep your KPIs on target. If you want to understand how outsourcing fulfilment can improve your performance indicators, get in touch for a tailored quote.
FAQ
What are fulfilment KPIs?
Fulfilment KPIs are measurable metrics that track how effectively orders are processed, picked, packed, and delivered. Core examples include On-time Delivery Rate, Order Accuracy, Perfect Order Rate, and Cost Per Order.
What is a good on-time delivery rate for e-commerce?
Industry benchmarks set the On-time Delivery Rate at 95% or above for standard e-commerce operations, with segmented approaches capable of achieving above 99.9% when KPIs are tracked by channel and service level.
How is Order Fulfilment Rate different from Order Fill Rate?
Order Fulfilment Rate measures end-to-end execution from placement to delivery, while Order Fill Rate measures inventory readiness at the point of order. A low Order Fill Rate with a high Line Fill Rate typically indicates specific SKU stockouts affecting multi-item orders.
How often should fulfilment KPIs be reviewed?
Speed and accuracy KPIs should be reviewed weekly, cost metrics monthly, and inventory accuracy per cycle count. Quarterly reviews are too infrequent and allow performance issues to compound before they are detected.
Why do KPI definitions matter so much in fulfilment?
Inconsistent KPI definitions, such as different start and stop times for delivery clocks, produce misleading data that leads to poor operational decisions. Standardising definitions centrally across all fulfilment partners is the prerequisite for credible measurement.
Recommended