TL;DR:
- Ecommerce return rates are typically around 19 to 20.5%, with apparel and footwear exceeding 25 percent.
- Most returns result from fit issues, inaccurate product content, and consumer behaviors like bracketing and over-ordering.
Ecommerce return rates are defined as the percentage of online orders sent back by customers, and they consistently run far higher than in-store equivalents. Average ecommerce return rates sit at 19–20.5%, compared to just 5–8.9% for physical retail. Apparel and footwear push that figure above 25%. The reasons why ecommerce returns increase are structural, not accidental. Fit uncertainty, inaccurate product content, and shifting consumer behaviour all compound the problem. For e-commerce professionals, understanding these drivers is the first step to reducing the operational and financial damage they cause.
Why do ecommerce returns increase due to fit and sizing issues?
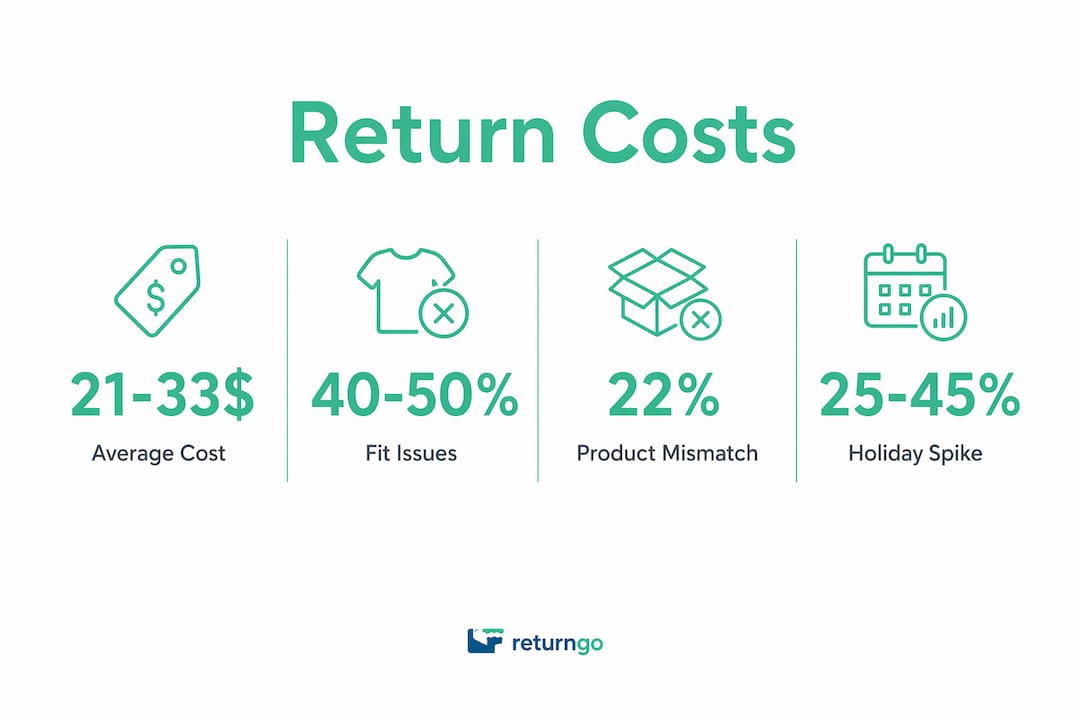
Sizing and fit problems are the single largest driver of apparel returns. Fit issues account for 40–50% of all clothing and footwear returns. That figure alone explains why fashion brands carry return rates that dwarf other categories.
The root cause is simple: customers cannot try products on before buying. A size 12 from one brand fits differently from a size 12 from another. Body shape variation, regional sizing standards, and category differences (fitted versus relaxed cuts, for example) all create uncertainty at the point of purchase. Customers resolve that uncertainty by ordering multiple sizes and returning what does not fit.
This behaviour is called bracketing, and it has become normalised across fashion retail. A customer orders a dress in sizes 10, 12, and 14, keeps one, and returns two. Each of those two returns costs the retailer money in carrier fees, labour, and restocking. The customer bears no psychological cost because free returns have trained them to treat the process as an extension of the fitting room.
Key factors that worsen sizing-related returns:
- Inconsistent size charts across brands and regions
- Lack of fit guidance for different body shapes
- No indication of model measurements or garment dimensions in product listings
- Absence of customer fit reviews filtered by body type
Pro Tip: Add a “fit feedback” field to your post-purchase review form. Ask customers whether the item ran small, true to size, or large. Display that data prominently on the product page. It costs nothing to collect and directly reduces the next customer’s uncertainty.
Fit technology tools, including virtual try-on and AI-powered size recommendation engines, are reducing return rates for brands that invest in them. Better size guides with garment measurements (not just generic S/M/L labels) produce a measurable reduction in fit-related returns without requiring a technology overhaul.
How do product representation gaps drive online returns?
22% of ecommerce returns occur because the product does not match its online portrayal. That is a significant share of returns caused entirely by the retailer’s own content, not the product itself.

The expectation gap forms when what a customer sees on screen differs from what arrives at their door. Colour is the most common culprit. A sofa photographed under studio lighting appears a warm taupe on screen but arrives looking grey in a customer’s living room. A dress that photographs as coral reads as orange on a different device’s display. These discrepancies are not fraud. They are the predictable result of inconsistent photography, uncalibrated screens, and product descriptions that rely on marketing language rather than factual detail.
AI-generated product descriptions are worsening this problem. When copy is generated at scale without human review, inaccuracies in material composition, dimensions, and care instructions slip through. A customer who buys a “luxurious velvet cushion” and receives a polyester blend with a velvet texture has a legitimate grievance, and they will return it.
Common content failures that create expectation gaps:
- Product images shot on white backgrounds only, with no lifestyle or scale context
- Colour names that are evocative rather than descriptive (“midnight” instead of “dark navy”)
- Dimensions listed in one unit only, without visual reference
- Material descriptions that use marketing terms instead of fabric composition percentages
Pro Tip: Treat your product page as a digital twin of the physical item. Every specification a customer would check in a shop (weight, texture, exact dimensions, care label) should appear on the page. Augmented reality visualisation tools, now available at mid-market price points, let customers place furniture or homeware in their own space before buying.
Improving product content accuracy is one of the highest-return investments a retailer can make. It reduces returns, reduces customer service contacts, and improves conversion rates simultaneously.
In what ways do consumer behaviour and payment options influence return rates?
Consumer psychology around online returns has shifted fundamentally over the past five years. Returns are no longer seen as an inconvenience. For a growing segment of shoppers, they are a planned part of the purchase process.
Bracketing, once confined to fashion, has spread into electronics and furniture as customers order multiple variants of a product intending to keep only one. Buy Now Pay Later (BNPL) options accelerate this behaviour by removing the immediate financial friction of spending. When a customer pays nothing upfront, ordering three versions of a standing desk to compare them at home feels costless. The psychological barrier that once limited over-ordering has been removed.
Four consumer behaviour patterns that push return volumes higher:
- Bracketing across categories. Customers order multiple sizes, colours, or models with the explicit intention of returning most. BNPL solutions reduce the financial friction that previously limited this behaviour.
- Buyer’s remorse. Impulse purchases driven by social media advertising result in returns once the initial excitement fades. This is particularly pronounced among Gen Z shoppers who discover products through short-form video content.
- Wardrobing. Customers purchase items for a specific occasion, use them once, and return them. This is most common in fashion and electronics.
- Return fraud. Stricter return policies have not reduced fraud. 44% of retailers report increased fraud after implementing return fees, compared to 42% reporting a reduction. Blanket fees push some customers toward fraudulent claims rather than deterring returns.
Seasonal patterns compound all of these behaviours. Global refund volumes increased 18.1% in 2025, with the holiday season accounting for 20% of annual refunds. December’s refund rate runs above the annual average at 2.89%. That concentration of returns in a short window creates operational pressure that compounds the financial cost.
What operational challenges do increased returns impose on ecommerce businesses?
Returns are expensive. The fully loaded cost of processing a single return in a mid-market direct-to-consumer brand averages £17–£26 (approximately $21–$33), covering carrier fees, labour, inspection, repackaging, and inventory depreciation. That figure does not include the capital cost of stock sitting in the returns pipeline rather than generating revenue.
| Cost component |
Description |
| Carrier fees |
Inbound return shipping, often subsidised or free for the customer |
| Labour |
Receiving, inspecting, sorting, and restocking each returned item |
| Repackaging |
Replacing damaged outer packaging to return stock to sellable condition |
| Inventory depreciation |
Value lost when returned items cannot be resold at full price |
| Capital cost |
Cash tied up in returned stock during the processing period |
High-return SKUs are frequently unprofitable when all hidden costs are included. A product with a 35% return rate and a £40 selling price may generate negative margin once returns processing is factored in. Identifying these SKUs and addressing the root cause (poor sizing data, misleading imagery, quality issues) is more effective than absorbing the cost.
Reverse logistics creates bottlenecks post-holidays, with return volume spikes of 25–45% above normal levels. Brands that have not planned for this surge face processing delays, inventory inaccuracies, and customer service backlogs simultaneously.
Pro Tip: Build a returns cost model for your top 20 SKUs by return volume. Include all five cost components in the table above. The results will tell you which products to fix first and whether any should be discontinued.
AI-driven return management tools now help distinguish legitimate returns from fraudulent or abusive behaviour. They flag patterns such as repeated high-value returns from the same account or returns of items that were never shipped back. This protects margin without penalising genuine customers.
How can ecommerce businesses reduce the increase in returns effectively?
Reducing return rates requires addressing the specific causes driving them, not applying a single blanket policy. The most effective approaches target fit uncertainty, content accuracy, and operational efficiency in parallel.
- Invest in size and fit technology. Virtual try-on tools and AI-powered size recommendation engines reduce fit-related returns. Even a basic size guide that includes garment measurements (chest, waist, length) rather than generic labels produces results. Accurate fulfilment practices also reduce returns caused by picking errors and wrong-item despatch.
- Audit and improve product content. Review your highest-return products and identify the content gap. Add lifestyle photography, accurate colour descriptions, and full material specifications. Augmented reality visualisation reduces returns in home decor and furniture categories.
- Adopt tiered return policies. A single free-returns policy applied to all customers and all products is both expensive and exploitable. Tiered policies that offer extended returns to loyalty members, or that charge a small fee for high-volume returners, reduce abuse without damaging the experience for genuine customers.
- Use data to identify abusive patterns. AI-driven return management tools flag accounts with return rates significantly above average. Acting on that data protects margin without creating friction for the majority of customers.
- Outsource reverse logistics during peak periods. Reverse logistics spikes of 25–45% post-holidays overwhelm in-house teams. Partnering with a 3PL provider for peak-season returns processing maintains throughput and keeps inventory accurate. Parcelplanet’s tactics to reduce ecommerce returns cover both the operational and policy dimensions of this challenge.
Key takeaways
Ecommerce return rates increase because of fit uncertainty, inaccurate product content, and consumer behaviours that treat returns as a standard part of the purchase process, each of which requires a targeted operational response.
| Point |
Details |
| Fit drives the majority of apparel returns |
Sizing issues account for 40–50% of clothing returns; size guides with garment measurements reduce this. |
| Product content gaps cause avoidable returns |
22% of returns result from mismatches between online portrayal and physical product; audit high-return SKUs first. |
| Consumer behaviour has normalised over-ordering |
Bracketing and BNPL-driven over-ordering are structural trends, not edge cases; tiered return policies address them. |
| Returns carry hidden costs |
Processing a single return costs £17–£26 on average; high-return SKUs are often unprofitable when all costs are included. |
| Peak seasons require proactive capacity planning |
Post-holiday return spikes of 25–45% demand either temporary staffing or 3PL partnerships to maintain throughput. |
Returns as a signal, not just a cost
I have worked with enough e-commerce brands to know that most treat returns as a pure cost line. The finance team sees the carrier fees, the warehouse team sees the labour, and everyone agrees the number needs to come down. What gets missed is that a high return rate is also a data source.
When 22% of your returns cite a product mismatch, that is your content team’s brief. When 40% cite fit, that is a product development and merchandising problem. When return fraud spikes after you introduce a return fee, that is a policy design failure. The return data tells you exactly where the breakdown is occurring between what you promise and what you deliver.
The brands I have seen reduce returns most effectively are the ones that treat the returns report as a quality audit. They map return reasons to specific SKUs, specific marketing channels, and specific customer segments. They find that a particular product generates returns because it was photographed in a colour that does not exist in real life, or that a specific acquisition channel attracts customers with a fundamentally different expectation of the product. Fixing those upstream failures reduces returns more reliably than any policy change.
Returns will never reach zero in ecommerce. The channel has structural disadvantages compared to physical retail that no policy can fully overcome. The goal is not elimination. The goal is understanding which returns were preventable and acting on that information before the next buying cycle.
— ChiefPlaneteer
How Parcelplanet supports efficient returns management
Managing the operational side of returns requires more than good intentions. It requires accurate picking and packing at the outset, reliable courier integrations, and the capacity to handle volume spikes without losing control of inventory.

Parcelplanet’s order fulfilment services are built for e-commerce brands that need dependable fulfilment accuracy and the flexibility to scale during peak periods. Fewer picking errors mean fewer wrong-item returns before they happen. Parcelplanet’s software integrations connect your sales channels and inventory systems in real time, giving you the visibility to act on return data quickly. If your return volumes are rising and your current logistics setup is struggling to keep pace, get in touch with the Parcelplanet team for a tailored quote.
FAQ
What is the average ecommerce return rate?
Ecommerce return rates average 19–20.5%, compared to 5–8.9% for physical retail. Apparel and footwear categories regularly exceed 25%.
Why do customers return online purchases most often?
Fit and sizing issues account for 40–50% of apparel returns, product defects affect 42–56% of returns across categories, and 22% of returns cite a mismatch between the product and its online description.
Does charging a return fee reduce return volumes?
Not reliably. 44% of retailers report increased fraud after introducing return fees. Tiered policies based on customer behaviour are more effective than blanket charges.
How much does processing a return cost an ecommerce business?
The fully loaded cost averages $21–$33 per return in mid-market direct-to-consumer brands, covering carrier fees, labour, repackaging, and inventory depreciation.
When do ecommerce return volumes peak during the year?
The holiday season accounts for 20% of annual refunds, with december’s refund rate running above the annual average. Post-holiday return spikes of 25–45% above normal levels are common across most product categories.
Recommended